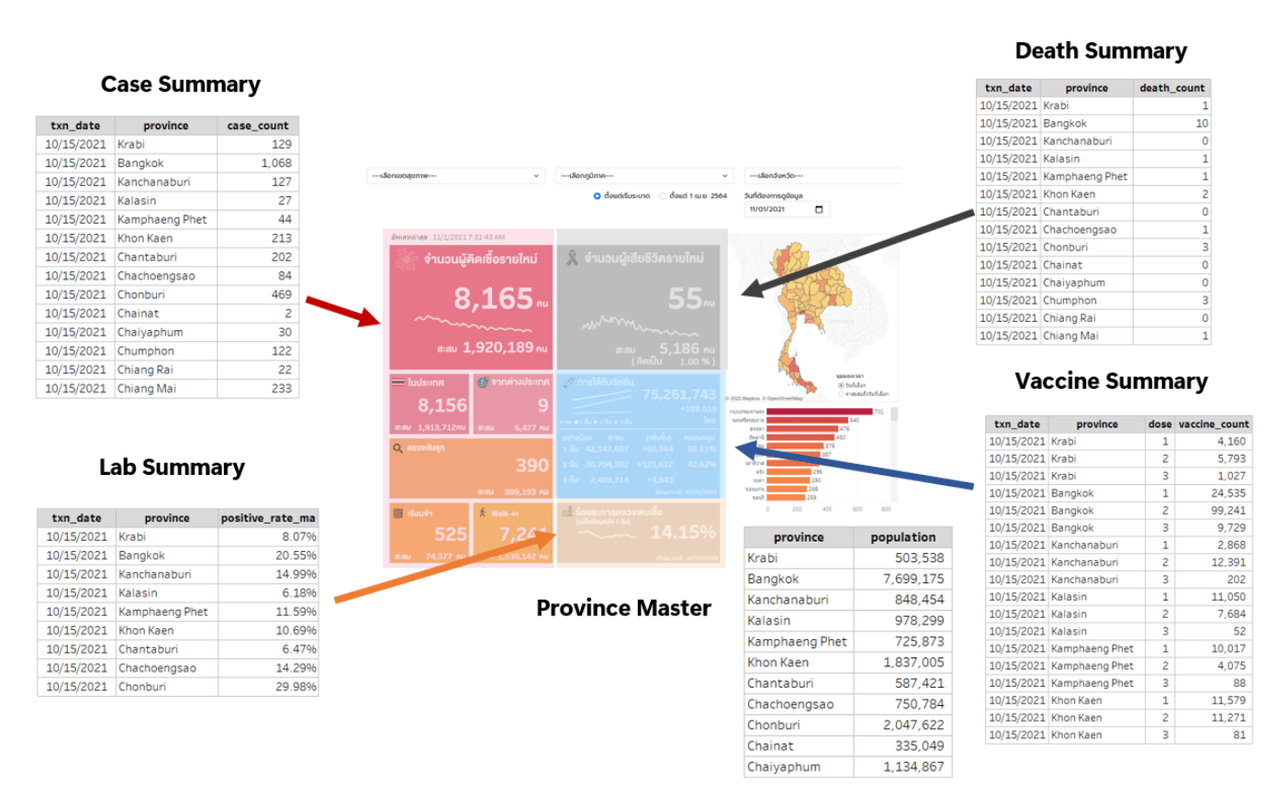
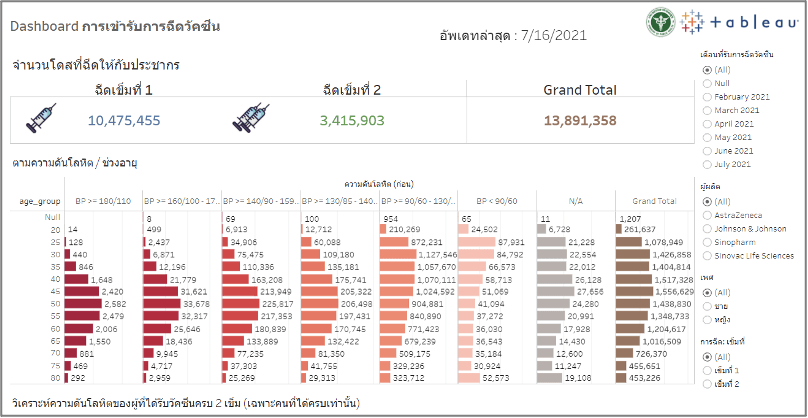
This is a story about how the Bangkok Tableau User Group leaders came together to help their government organize and understand their data to better equip themselves against the COVID-19 situation in Thailand. We invited Nontawit Cheewaruangroj and Vorapol Santhadkolkarn to share how they helped the government visualize their data and continue to get valuable insights.
